
Spain has seen wildfires burn over 400,000 hectares of land this year, with record setting temperatures, and its most intense heat wave yet in August 2025. In response to this, there is increased urgency for climate action. The Spanish government has introduced mandatory carbon reporting requirements for businesses and public entities through Royal Decree 214/2025. The decree operationalizes Spain’s Law 7/2021: Climate Change and Emergency Transition, which provides a framework for climate action and was adopted in 2021 with the goal of being climate neutral by 2050.
However, the regulation is only one side of what companies must do. Another challenge will be managing the climate data to deliver accurate reporting: understanding what data is needed, where to find it, and how to ensure it’s impactful.
In this article we break down Spain’s new carbon reporting requirements and explore how businesses can manage the data they need.
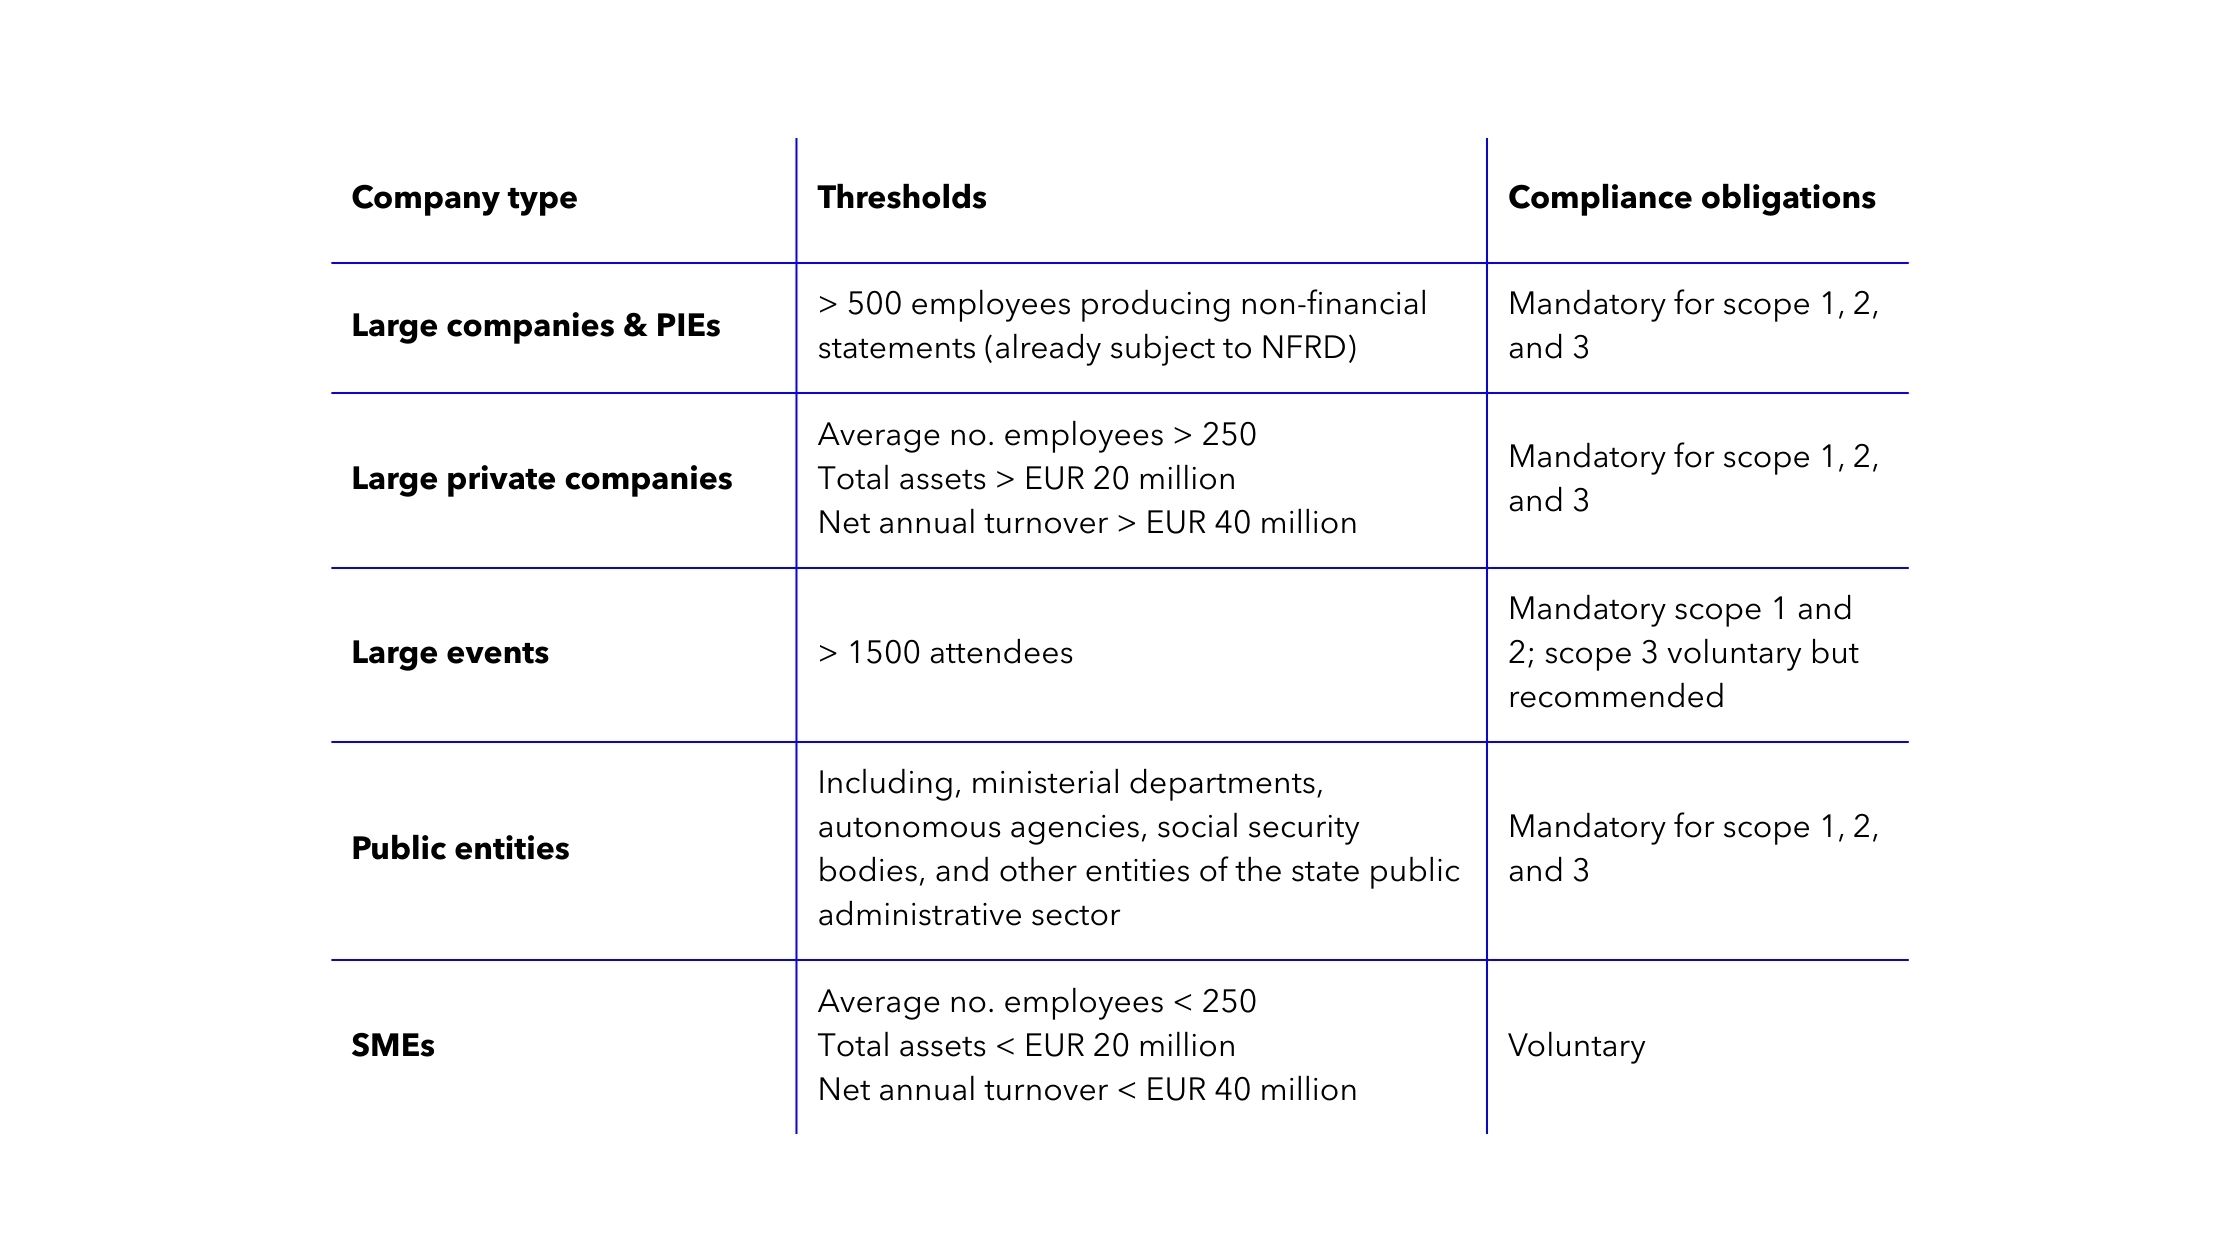
Royal Decree 214/2025 came into force on June 6th 2025 as part of Spain’s climate emergency plan, making it mandatory for in-scope companies to calculate and publish their carbon footprint.
The following methodologies can be used for carbon footprint calculation:
Data can be one of the biggest challenges for companies when reporting on their carbon footprint. It’s scattered across invoices, bills, and supplier systems; it comes in inconsistent formats; and it can have gaps. Even when you have sourced the activity data, you still need to choose the right emission factor and not all datasets are reliable, transparent, or complete.
MITECO publishes emission factors that must be used for reporting and calculating emissions. Exceptions to this requirement include:
If you use an emission factor other than those published by MITECO, you must provide verification and justification.
MITECO emission factors will soon be added to the Climatiq database.
Let’s break down what this data collection and emission calculation process might look like for an example company across scopes 1, 2, and 3.
Company profile:
→ Must comply with Royal Decree 214/2025 for scopes 1, 2, and 3.
For this example, the company is calculating their 2024 emissions, but the approach is consistent with what they would have to do to report their emissions under Royal Decree 214/2025.
Emission sources vary between companies and are dependent on the industry you’re in and your operations. The examples below are common emission sources for a manufacturing company. For each source, you’ll see an example of what data is needed and where you can likely find it.
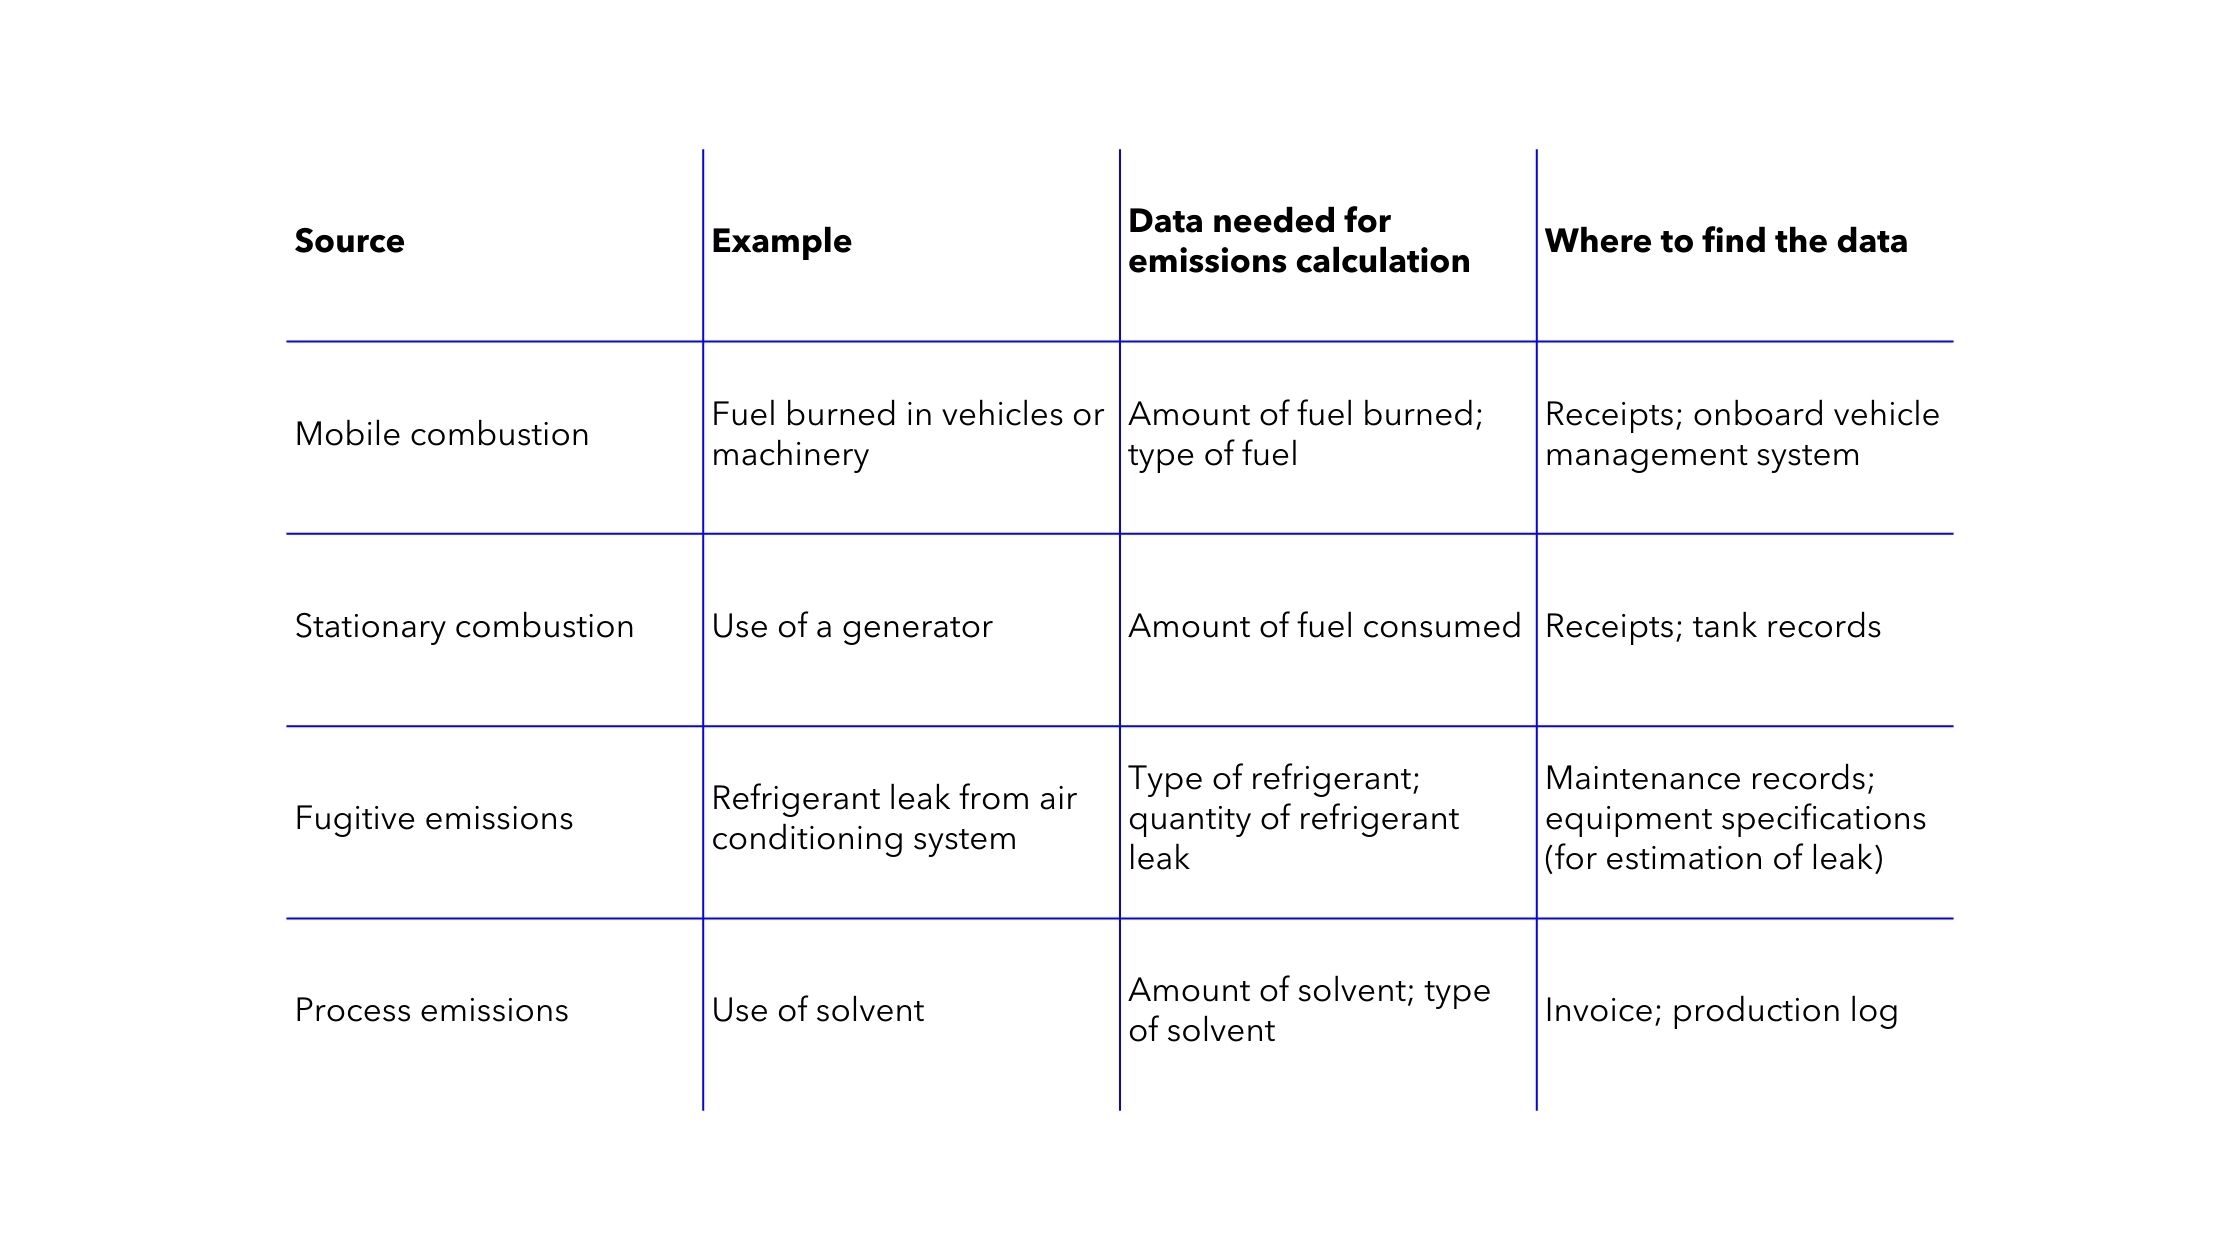
Scope 1: Direct emissions
Scope 1 covers direct emissions from a company’s owned assets. Here’s what that may look like:
Example: Calculating scope 1 emissions
The manufacturing company needs to calculate their scope 1 emissions. They need the following data, which they can find from fuel receipts and onboard vehicle management systems:
If they have it available, the company can provide more activity data in order to get a more accurate CO2e estimate:
They found they burned 50,000 litres of diesel in 2024. They found the applicable emission factor from MITECO and calculated the scope 1 emissions for mobile combustion.
Activity data: 50,000 litres of diesel in 2024 in Spain
Emission factor: 2.520 kgCO2e/l | MITECO, Factores de emisión 2024, Gasóleo B7 (camiones N2/N3) | emission factor for trucks provided by MITECO
Calculation: 50,000 x 2.520
Result: 126,000 kgCO2e
Scope 2: Indirect emissions
Scope 2 emissions are indirect emissions from the purchase of electricity, heat, and steam. Below are examples of this:

Example: Calculating scope 2 emissions
The manufacturing company needs to calculate their scope 2 emissions from electricity consumption from one of their offices. The company needs the following data:
Additional information, although not required, will give a better estimate of emissions:
They calculated both the location-based emissions and market-based emissions using official MITECO emission factors for the Spanish market. Energy is a key area to have access to local emission factors, as different countries can have very different energy mixes, even in neighboring countries. For example, Portugal has a renewable-heavy grid with much lower emissions than Spain.
Activity data: 19,000kWh electricity consumed in 2024 in Spain
Location based approach:
Market based approach:
Scope 3: Value chain emissions
Scope 3 emissions are indirect emissions from a company’s value chain. The following table provides examples of common scope 3 emissions sources for a manufacturing company. (Companies are not expected to report on all 15 categories, but rather those that are material to their operations.)

Example: Calculating scope 3.1 emissions (Purchased Goods & Services)
The manufacturing company needs to calculate their emissions for scope 3.1, from importing stainless steel rebars for construction. They need the following activity data:
For a spend-based method, they need:
Activity data: 500 kg of stainless steel rebar imported; 2024; purchased from United Kingdom
Emission factor: 3.777kgCO2e/kg | Stainless steel rebar | Oekobaudat | cradle-to-gate
Calculation: 500 x 3.777
Result: 1888.5 kgCO2e
Alternatively, had they not had this data on hand, they could get an estimate of emissions using the spend based approach. Reputable sources for spend-based emission factors include EXIOBASE and CEDA.
Amount spent x spend-based emission factor = total kg/CO2e
Example 2: Calculating scope 3.4 emissions (Upstream Transportation & Distribution)
The manufacturing company also needs to calculate the scope 3.4 emissions associated with transporting the steel they purchased from the production site to their manufacturing plant. The company orders steel from a London-based steel supplier and gets it delivered to their factory in Bilbao, Spain. They need the following activity data:
If available, additional details could make the estimates more accurate, such as:
In this case, the company only had basic activity data.
Activity data: London → London Port (road), London Port → Bilbao port (sea), Bilbao Port → Factory in Bilbao (road); 500kg cargo (steel)
Emission factor: GLEC emission factors (multiple used due to multi-modal transportation)
Calculation: Emissions calculated for each leg and totaled via Climatiq’s Freight endpoint, which you can also access via the Excel add-in.
Result: 9.12 kg/CO2e

If you need more information on how to calculate emissions from transport, check out our guide.
Scope 3 comes with the added challenge of gathering data from the value chain. It requires wider internal engagement, supplier data, and in some cases reliance on industry averages. Getting activity data for scope 3 calculations can be difficult and time consuming, and once you’ve collected the data it can have gaps, be inconsistent, and need cleaning. That’s why many companies opt to use spend-based methods to calculate scope 3 emissions, particularly for category 3.1 (Purchased Goods & Services). Over time, these companies may transition to using activity-based methods once they’re more familiar with reporting methods and have adopted a data management strategy.

Spain’s new mandatory carbon reporting and California’s mandatory disclosure rules show how careful large companies now need to be to ensure they comply with regulations in every market. While attention has been focused on higher level changes, such as the SEC rule being revoked in the US and the Omnibus proposal in the EU, other jurisdictions are moving to implement carbon reporting regulations on their own schedule.
To stay ahead, companies need to remain flexible and proactive. A strong, reliable data strategy will have you ready for shifting reporting requirements, and is the foundation for credible climate action. Those who prepare now will be better positioned for compliance and lead in the transition to a green economy.


.svg)
