


This is our fifth post in a series of articles dissecting how to measure greenhouse gas emissions from data centers and cloud services. This article examines the cradle-to-gate emissions of data centers using product carbon footprints as a basis.
Check out previous posts in this series to learn about A) the primary sources of greenhouse gas emissions in data centers B) the role of the big three, namely AWS, Azure, and GCP, C) how to assess emissions from your specific computing activities, including on-prem data centers and hybrid set-ups, and D) how to lower your cloud computing footprint.
A data center has already emitted millions of kilograms of CO2e before a single prompt is processed. That’s the blind spot behind the more familiar energy and water use story: the embodied emissions of the hardware—and its frequent turnover—are easy to miss and hard to shrink.
Data centers are full of electronic components, like chips, which pile on the embodied emissions through intensive manufacturing processes. With data centers demanding equipment to be in constant use, their components (like the servers and cooling systems) have a very short lifespan and need regular replacements. AI servers can be obsolete in a single year. Standard servers last three to five. Every time they’re replaced, they take another slice of embodied carbon with them. While moves are being made to reduce the mammoth demand data centers place on water and energy sources, this raises the question of what we can do in parallel to cut upstream emissions from building the hardware and infrastructure itself.
The first step—as with anything in carbon accounting—is measurement. Quantifying the footprint of a data center isn’t easy because they vary hugely and data is scarce. To provide some transparency and push the discussion, we’re going to have a go at calculating the cradle-to-gate footprint of an AI data center with some help from our product carbon footprinting tool, PCF Studio.
It helps to have a grip on some relevant concepts and terms used in the carbon accounting space before we get started.
A product carbon footprint (PCF) measures the total greenhouse gas emissions of a product across various stages of its lifecycle, such as production, use, and disposal. A PCF focuses directly on the footprint of an individual product rather than an entire company.
As with any company or facility, the emissions from data centers can be broken down across the Greenhouse Gas Protocol’s three scopes. Scope 3 emissions are all indirect emissions that occur in a company’s value chain, which often make up a huge percentage of their total carbon footprint. For that reason scope 3 is the primary focus in carbon accounting and decarbonization efforts, and the one we’ll focus on here for our cradle-to-gate footprint.
The big one for most facilities, this is electricity consumption for:
Often the most underestimated, and, in many cases, one of the largest over the full lifecycle when hardware needs to be replaced:
Here we will focus on the cradle-to-gate product carbon footprint of a data center, which falls into scope 3. For more info on emissions from operations, check our previous blog article here.
When calculating product carbon footprints (or doing any carbon accounting) it’s important to define what life cycle of the product you are measuring.
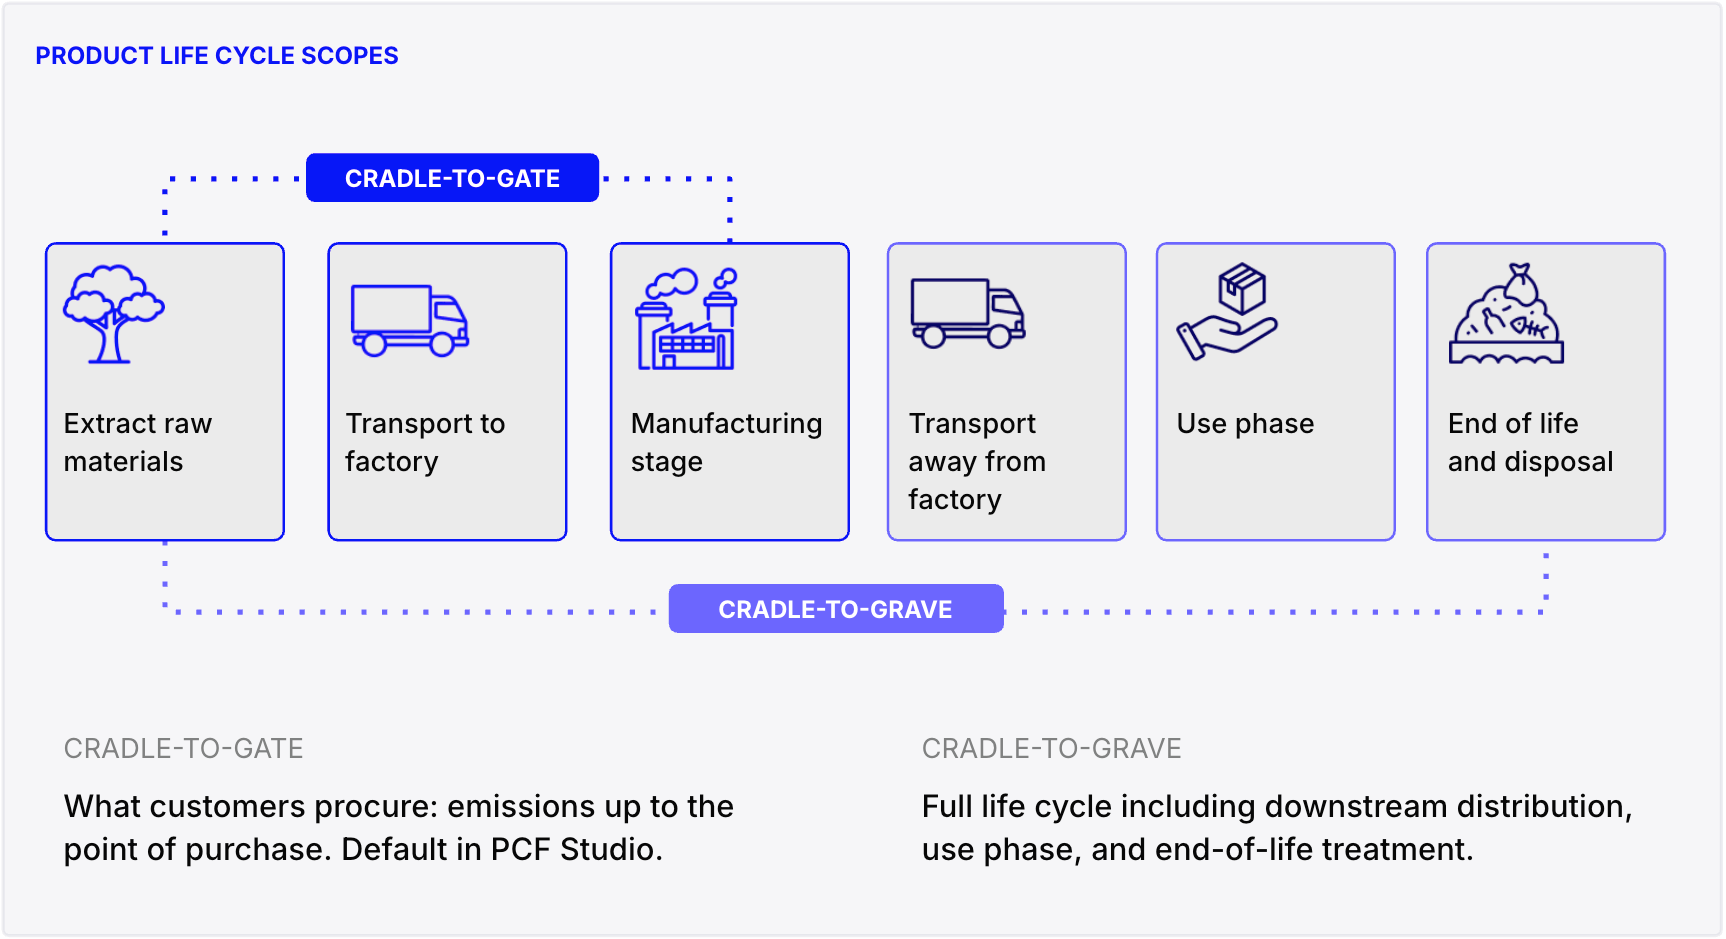
In this example, a cradle-to-gate calculation would include the emissions from sourcing, manufacturing, and transporting the data center’s components until they leave their point of manufacture. A cradle-to-grave study would also measure the emissions from running the hardware and disposing of it. What we’ll be doing here is a cradle-to-gate footprint.
Data centers are gargantuan in scale. An average data center might be around 10,000 sqm, but hyperscalers can be 100x that size, equalling about 130 football fields.
To give a rough overview of what goes on inside a data center:
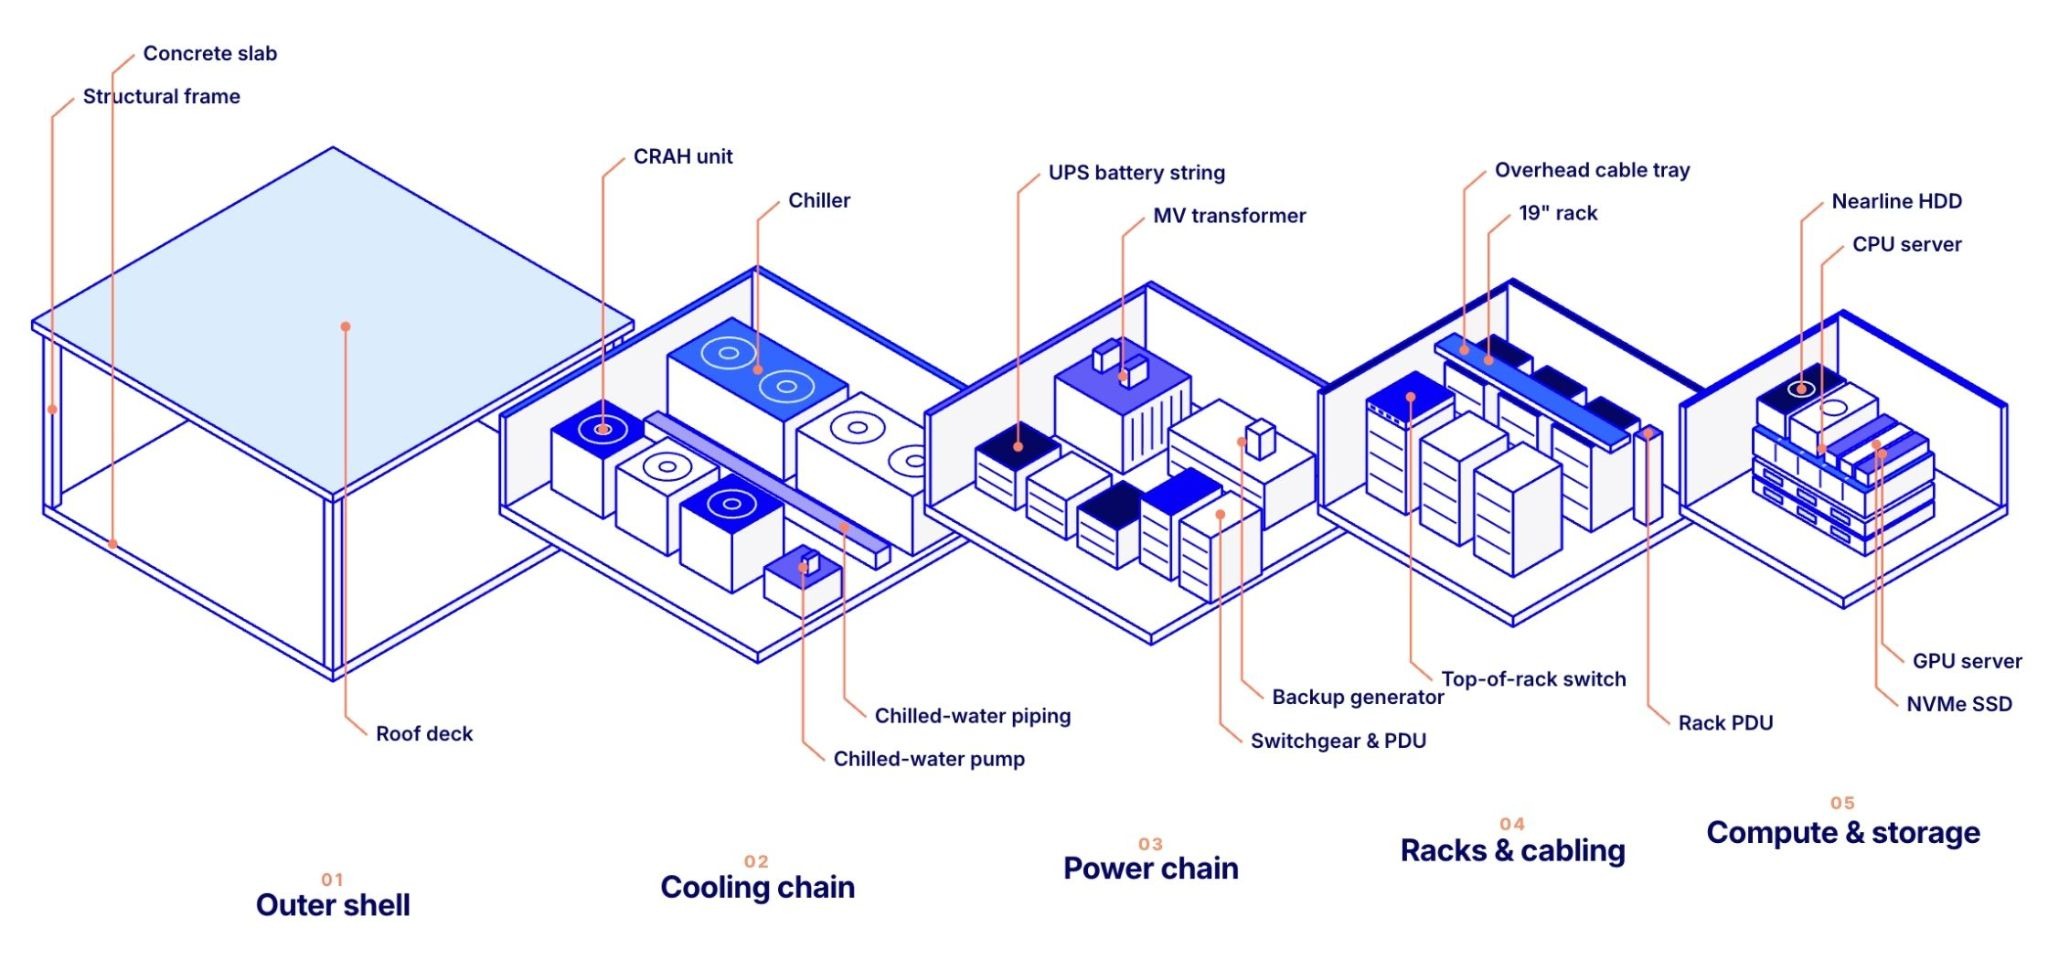
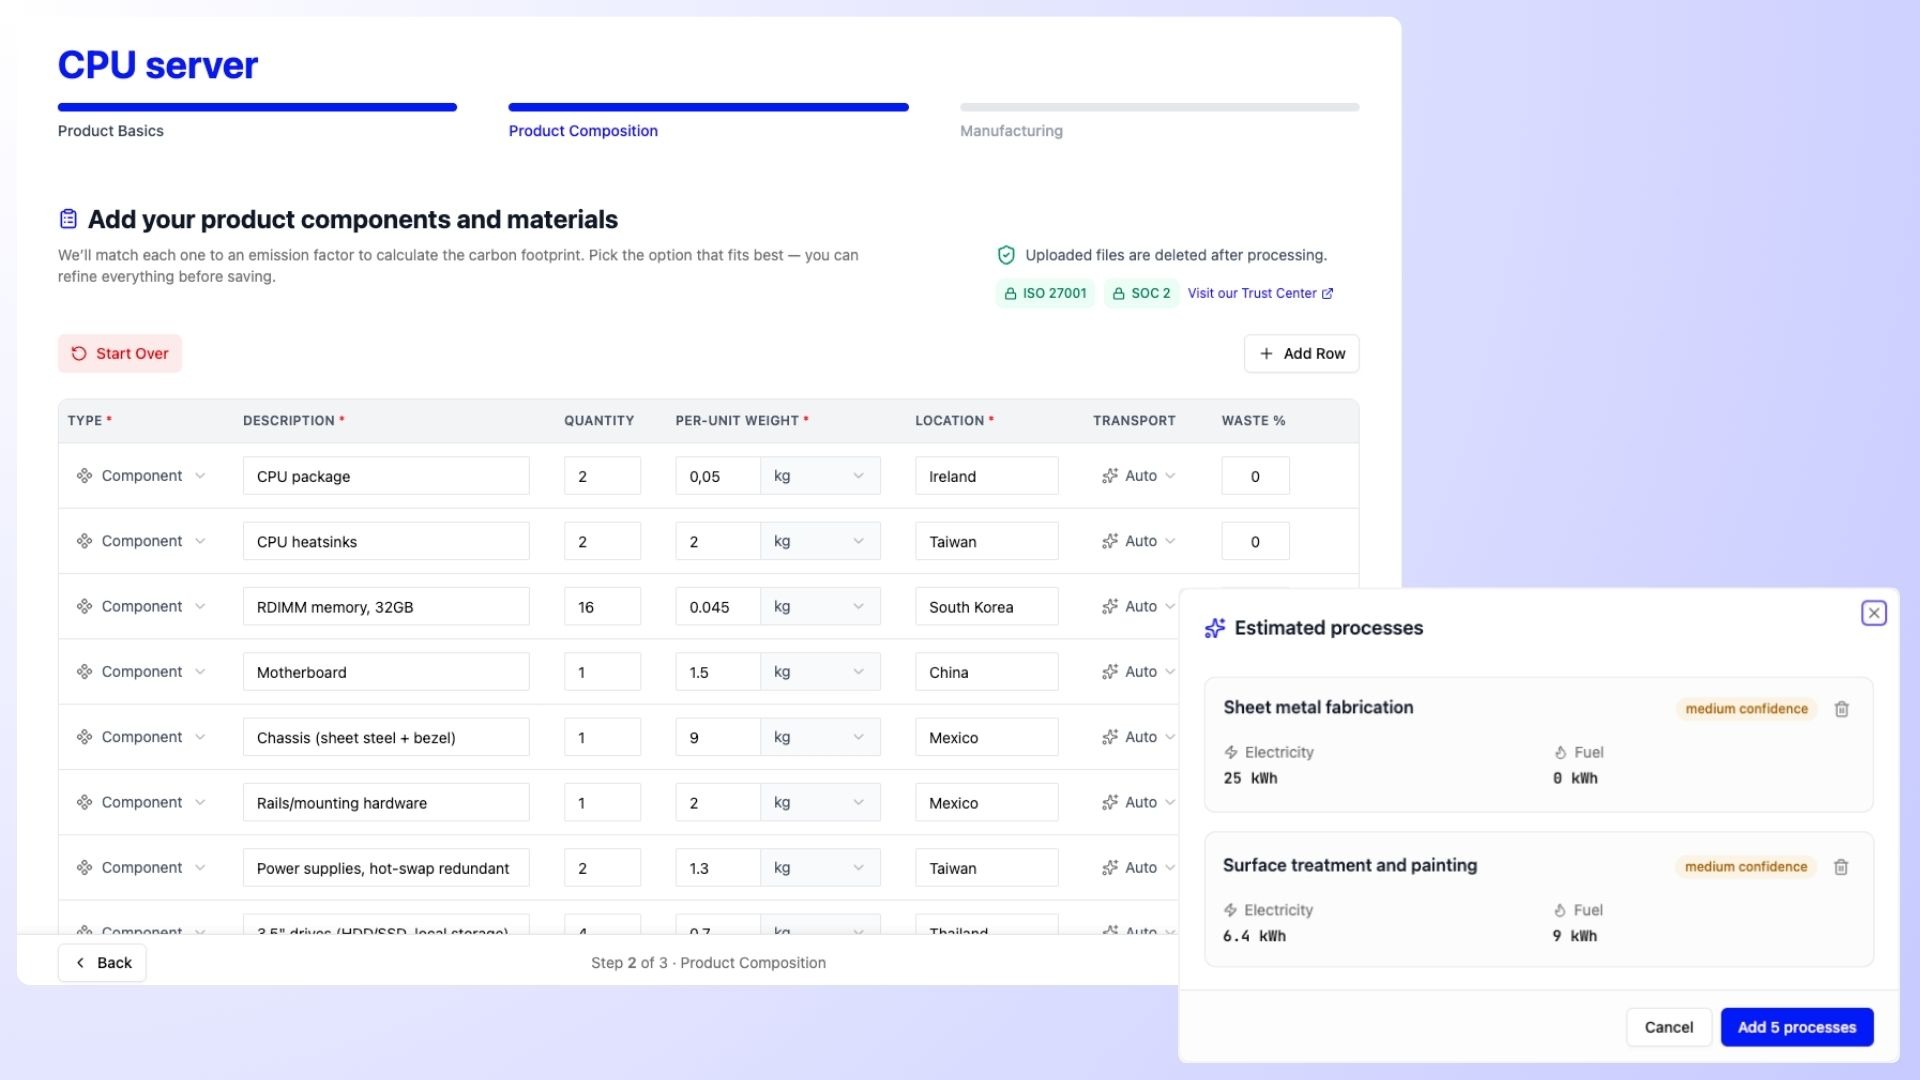
We decided to directly compare the footprint of a CPU server vs a GPU server using PCF Studio. This allowed us to start building a picture of what an AI data center’s carbon footprint might look like, and to sense check official PCFs published by manufacturers like Dell and NVIDIA. P.S. You can check out our PCF Explorer to find a list of publicly available PCFs.
*Disclaimer: While some companies provide a PCF declaration for the data center components they produce, BoMs (bills of materials, a comprehensive list of the materials and components which make up a product, including details like weights and sourcing locations) are hard to come by. For this reason, we have used publicly available information to create a sample BoM to use as the basis for our PCF calculations.
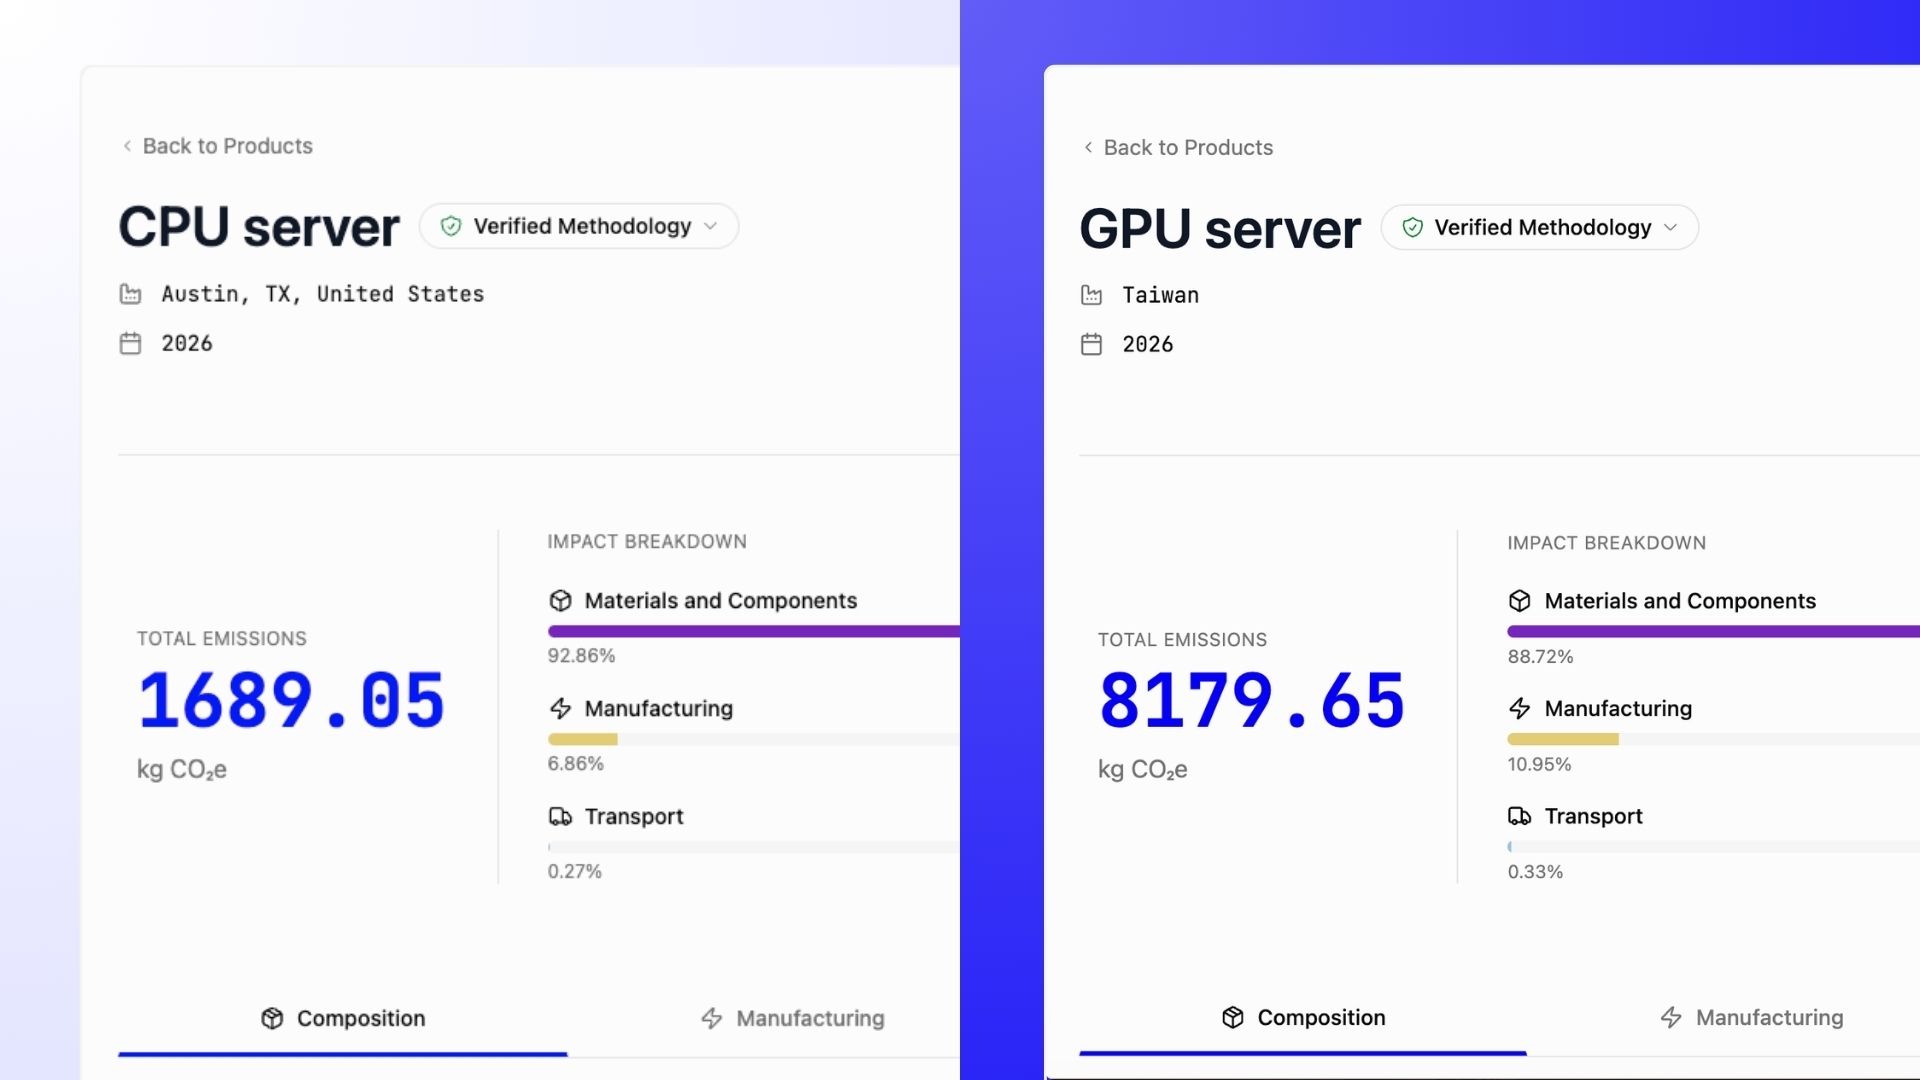
Our estimates fall comfortably within the ranges we found for published server PCFs online. When applying those figures to our overall footprint, we decided to include a lower, middle, and upper figure in our modeling of a ~500-AI-server data center (size reference taken from NVIDIA) to reflect the huge range in estimates we found across sources. Factors like server composition, materials, sourcing locations, manufacturing processes, and energy sources can all change these estimates and are the reason for such large discrepancies.
This brings to light the huge difference between GPU servers—which are becoming more common—and normal CPU servers, and consequently the footprint of AI data centers themselves. Not only their energy demand and water usage is far higher; the hardware itself is significantly more carbon intensive.
We applied this same logic across all major data center components, using published PCF estimates where available to validate the numbers.
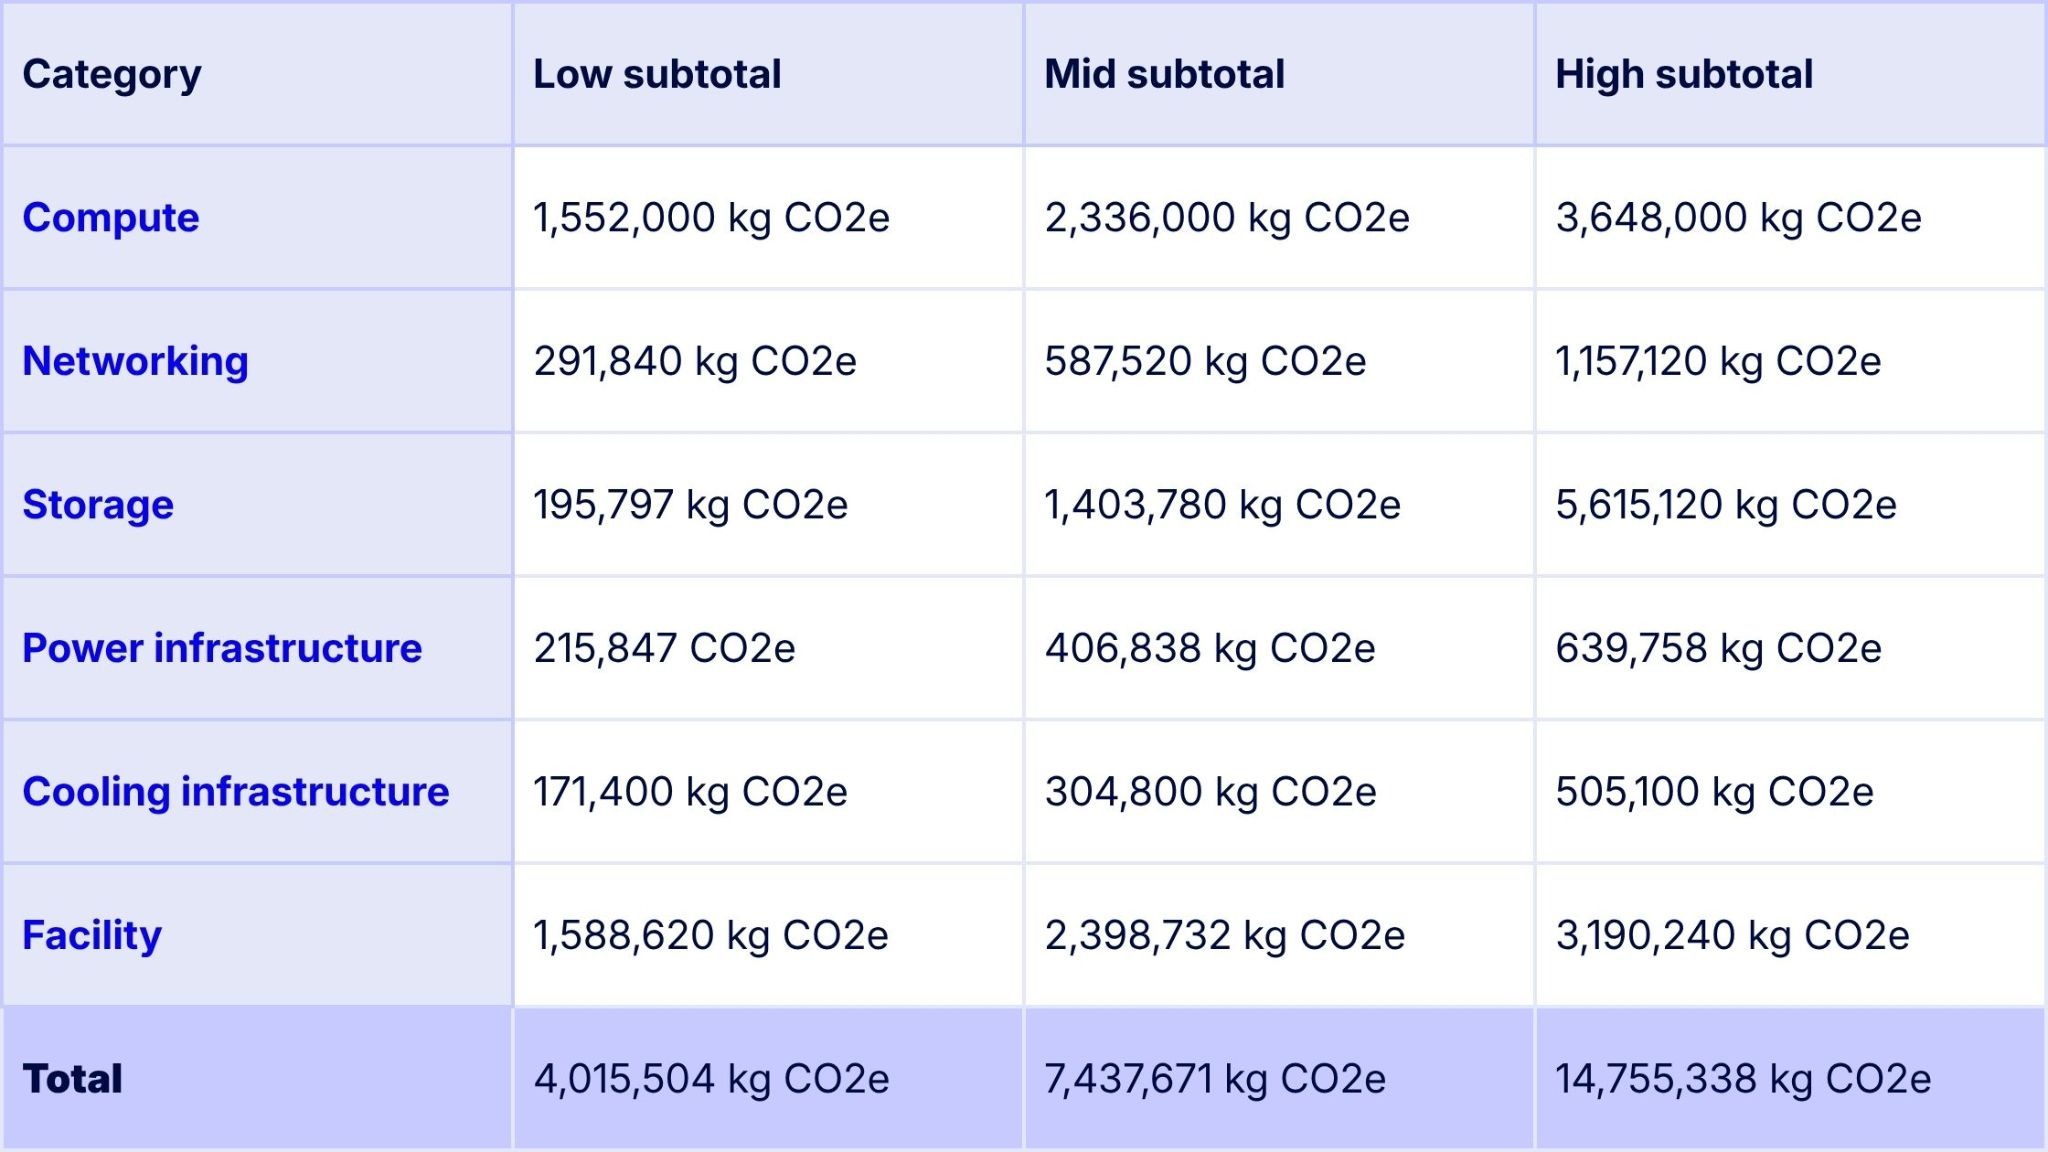
Our calculations place the likely cradle-to-gate estimate for a ~500 server AI data center between about 4,000,000 and 15,000,000 kg/CO2e. The mid range total—7,437,671 kg/CO2e—would be equivalent to driving 1,617 vehicles for a year (gasoline cars, average use). You can see a full breakdown of our results, along with assumptions used, here.
It’s important to keep in mind that data centers vary hugely in size and even composition. An AI-focused data center has fewer but more powerful servers (more GPUs per server), while hyperscalers can have hundreds of thousands of servers.
Data centers are the backbone of the digital world. Their carbon footprint shouldn't be invisible. Cradle-to-gate emissions alone can run into millions of kg CO2e, yet we're still treating that number like an afterthought.
With the help of PCFs, we can change emissions that happen "somewhere in the supply chain" into a clear picture of exactly where hotspots live so that decarbonization stops being a guessing game and starts being a plan.
If you’re interested in running some PCF calculations of your own, you can try PCF Studio here (the first five PCFs are free).


.svg)


